We like to think of the internet as an invisible, weightless cloud. But the reality? If the information and communications sector were a country, it would be the seventh-largest polluter on Earth. Every time a user clicks, scrolls, or loads a page, real energy is burned, and real carbon is emitted.
For the digital marketers and online communicators, this creates a tough dilemma. We are obsessed with online performance: more traffic, higher engagement, faster speeds and conversions. But rarely do we stop to ask the footprint left behind: What is the environmental price tag of that performance?
Acara Strategy, a consulting firm specializing in strategic communications, found themselves asking exactly that question. As they prepared to refresh their website in mid-2025, the team recognized an opportunity to examine something most businesses ignore entirely: the hidden environmental cost of every visitor interaction on their digital properties.
They partnered with Everything Green to conduct a comprehensive audit between mid-June and mid-July 2025, transforming what could have been a standard website upgrade into an investigation of the digital ecosystem behind their online presence. To carry out the work, Everything Green used the patented method of its online tool, the Green Score (GS) methodology present in the tool.
The challenge was clear: how does the performance of a website impacts the footprint.
Overcoming the Challenge: Measuring the Invisible
The challenge wasn’t just technical. How does website performance actually impact environmental footprint? And more importantly, could improving user experience simultaneously reduce carbon emissions?
To answer these questions, Everything Green deployed their proprietary Green Score methodology, which tracks emissions across a website’s entire lifecycle: from the manufacturing of server chips and data center operations all the way to the battery drain on each visitor’s device.
The Hidden Problem: When Bad UX Becomes Environmental Waste
When most teams talk about website analytics, the conversation stops at load times, bounce rates, and SEO rankings. Acara wanted to go deeper, and their results show one of the most common misconceptions propagated in today’s headlines.
The majority of Acara and other website emissions are not like LLMs. The emissions don’t come from servers humming in data centers. Instead carbon emissions come from visitors’ devices. The actual infrastructure, what most people imagine when they think of website carbon footprint, represented a minority of emissions.
This is where the importance of understanding the footprint impact enters. When a user lands on your site, waits for heavy scripts to load, gets confused by the navigation, and bounces without finding what they need, you haven’t just lost a lead. You’ve burned energy and emitted carbon for zero result. The infrastructure ran, the data moved across networks, the visitor’s device worked to render your page, yet all that effort produced nothing of value.
For websites, business performance and environmental performance converge at visitor traffic. Websites with low conversion rates essentially burn energy for nothing, while high-converting sites ensure every watt of energy spent delivers actual value, whether that’s a download, a purchase, or an answered question.
Breaking Down the Numbers: What the Data Actually Showed
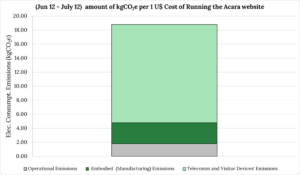
The Green Score methodology examined energy consumption at every level. While server hardware choices do matter, these operational details pale in comparison to the visitor-side emissions. The real story emerged when Everything Green’s Green Score analyzed the monthly emission inventory of the Acara website:
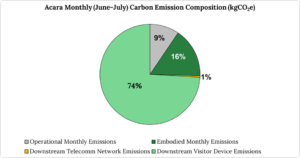
Most Acara emissions came from the visitors’ devices (74%) and the transmission to those visitors (1%), followed by the embodied emissions, i.e. the emissions that resulted from making the hardware for running the website (16%). The real percentage from running the website was only 9% of the total.
Desktop visitors generated the highest carbon load per session, followed by mobile users. The website’s own operational fo
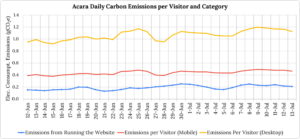
otprint appeared almost negligible by comparison. This pattern held consistent throughout the monitoring window, but something more interesting emerged when the team overlaid conversion rate data and saw the relationship between conversions and emissions:
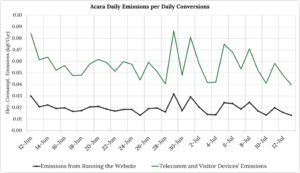
The relationship between conversion efficiency and carbon output became crystal clear. On days when Acara’s conversion rate dipped, the wasted emissions metric spiked proportionally. Every visitor who failed to complete their intended action represented pure environmental waste: energy expended with nothing to show for it. Conversely, when conversion rates improved, the same traffic volume produced fewer wasted emissions because more visitors accomplished their goals efficiently.
And most importantly, understand which performance benchmarks to expect not only in terms of conversions and revenue, but also estimations about the footprint generated:
The Acara Strategy case proves that the often-repeated dilemma between sustainability and high performance is a false choice. Likewise, websites have different emission profiles than LLMs, and to think on websites, one must think on traffic performance and journey.
When you help users find what they need quickly, you’re simultaneously reducing the web’s invisible weight. Every streamlined user journey, every eliminated unnecessary script, every improved navigation flow serves both conversion goals and climate goals.
Conclusion
The implications extend far beyond Acara’s specific situation. For any organization with digital properties, three questions become essential:
- First, what is your true bounce rate cost when you account for wasted energy and emissions?
- Second, where in your user journey are visitors getting stuck, spinning their wheels, and burning carbon without accomplishing their goals?
- And third, how can you deliver value faster, reducing both the time and energy required for successful interactions?
Ready to see where your website stands? Measuring your digital carbon footprint is about understanding the true efficiency of your digital operations. Try our web tool to identify where your emissions concentrate, then focus optimization efforts on the areas where improved user experience delivers the biggest carbon reduction.
Your bounce rate has always affected your bottom line. Now you know it’s affecting the planet too.